Metrics
In this section, we will introduce the MetricsReporter and HoodieMetrics in Hudi. You can view the metrics-related configurations here.
MetricsReporter
MetricsReporter provides APIs for reporting HoodieMetrics to user-specified backends. Currently, the implementations include InMemoryMetricsReporter, JmxMetricsReporter, MetricsGraphiteReporter and DatadogMetricsReporter. Since InMemoryMetricsReporter is only used for testing, we will introduce the other three implementations.
JmxMetricsReporter
JmxMetricsReporter is an implementation of JMX reporter, which used to report JMX metrics.
Configurations
The following is an example of JmxMetricsReporter. More detailed configurations can be referenced here.
hoodie.metrics.on=true
hoodie.metrics.reporter.type=JMX
hoodie.metrics.jmx.host=192.168.0.106
hoodie.metrics.jmx.port=4001
Demo
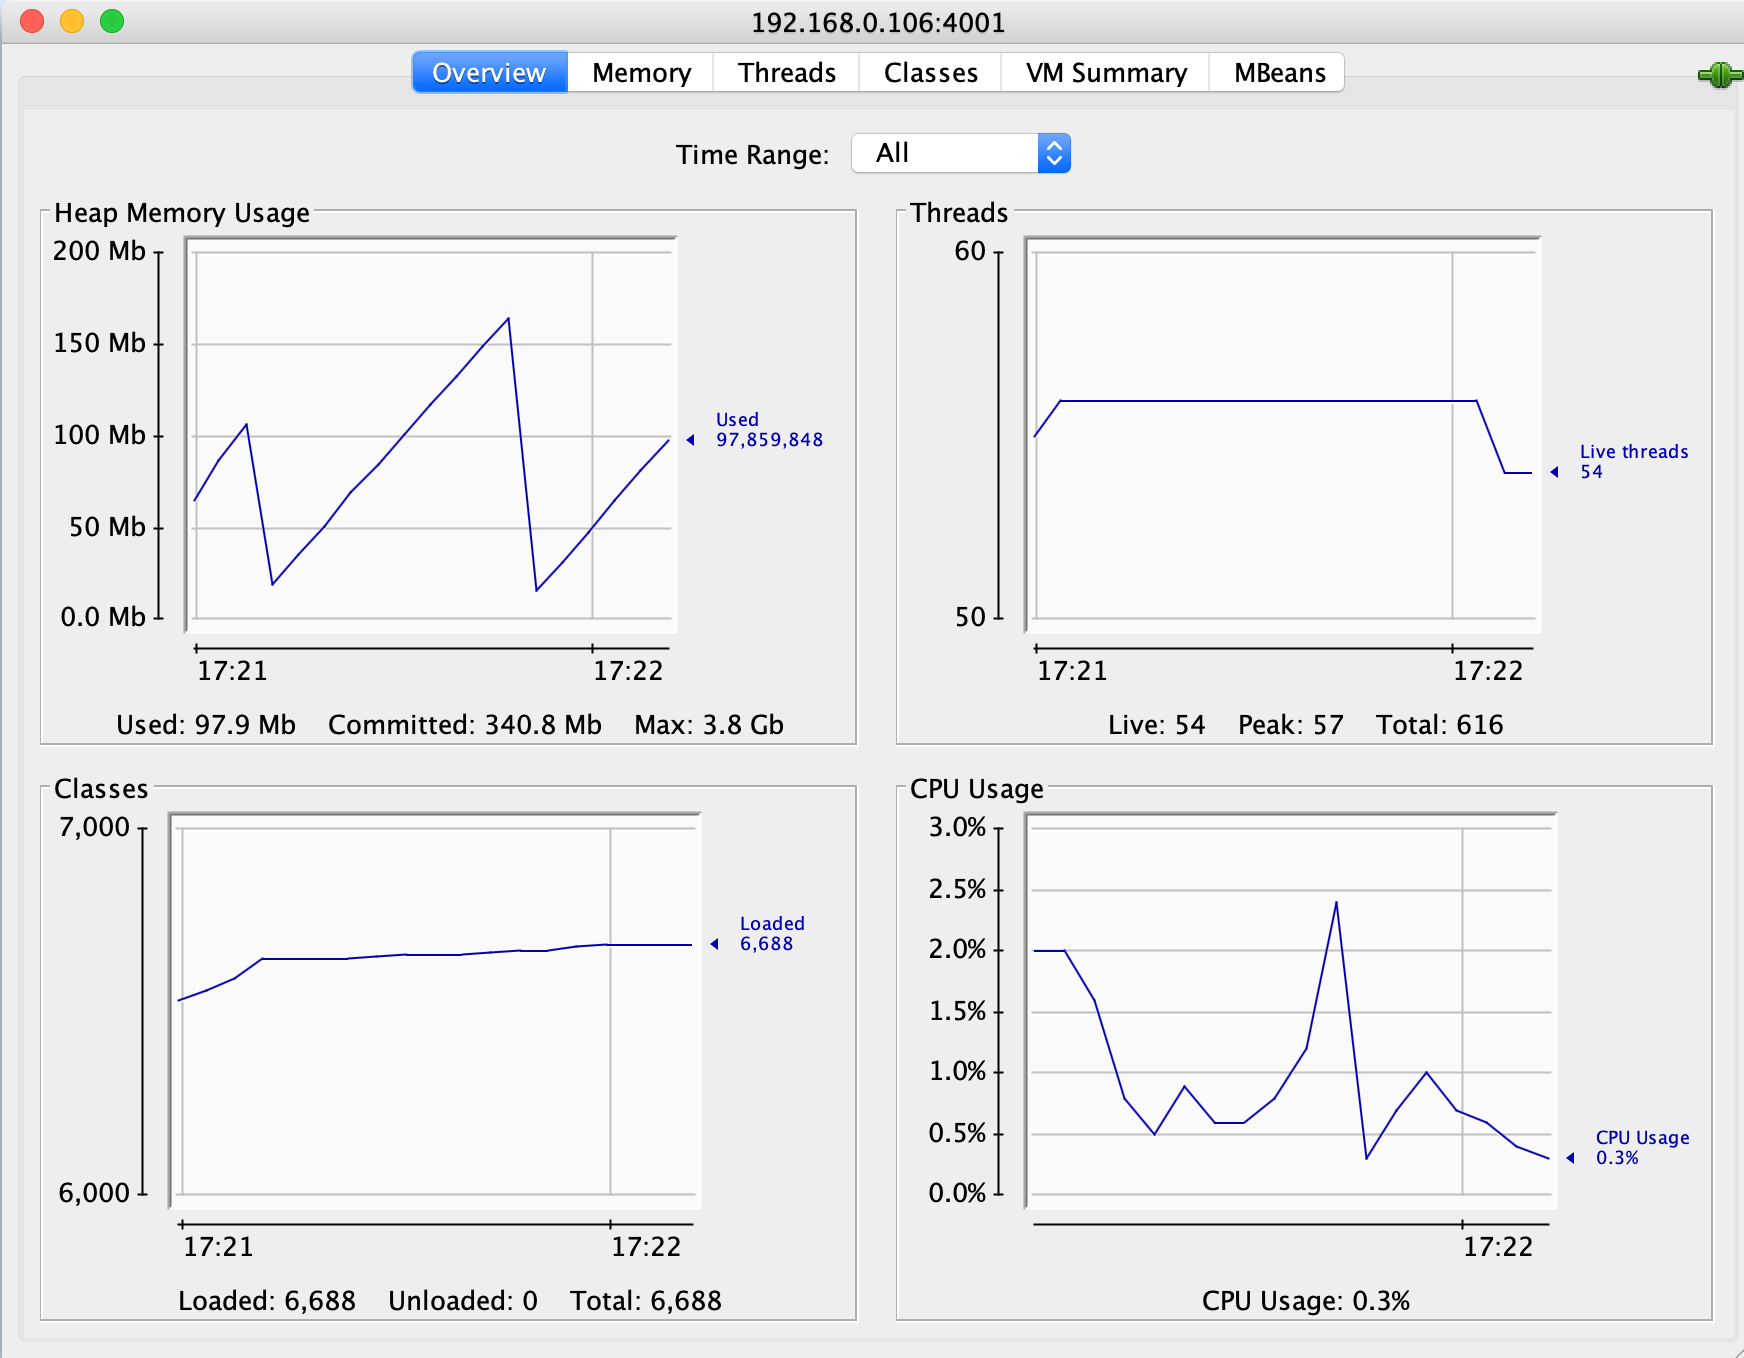
As configured above, JmxMetricsReporter will started JMX server on port 4001. We can start a jconsole to connect to 192.168.0.106:4001. Below is an illustration of monitoring Hudi JMX metrics through jconsole.
MetricsGraphiteReporter
MetricsGraphiteReporter is an implementation of Graphite reporter, which connects to a Graphite server, and send HoodieMetrics to it.
Configurations
The following is an example of MetricsGraphiteReporter. More detaile configurations can be referenced here.
hoodie.metrics.on=true
hoodie.metrics.reporter.type=GRAPHITE
hoodie.metrics.graphite.host=192.168.0.106
hoodie.metrics.graphite.port=2003
hoodie.metrics.graphite.metric.prefix=<your metrics prefix>
Demo
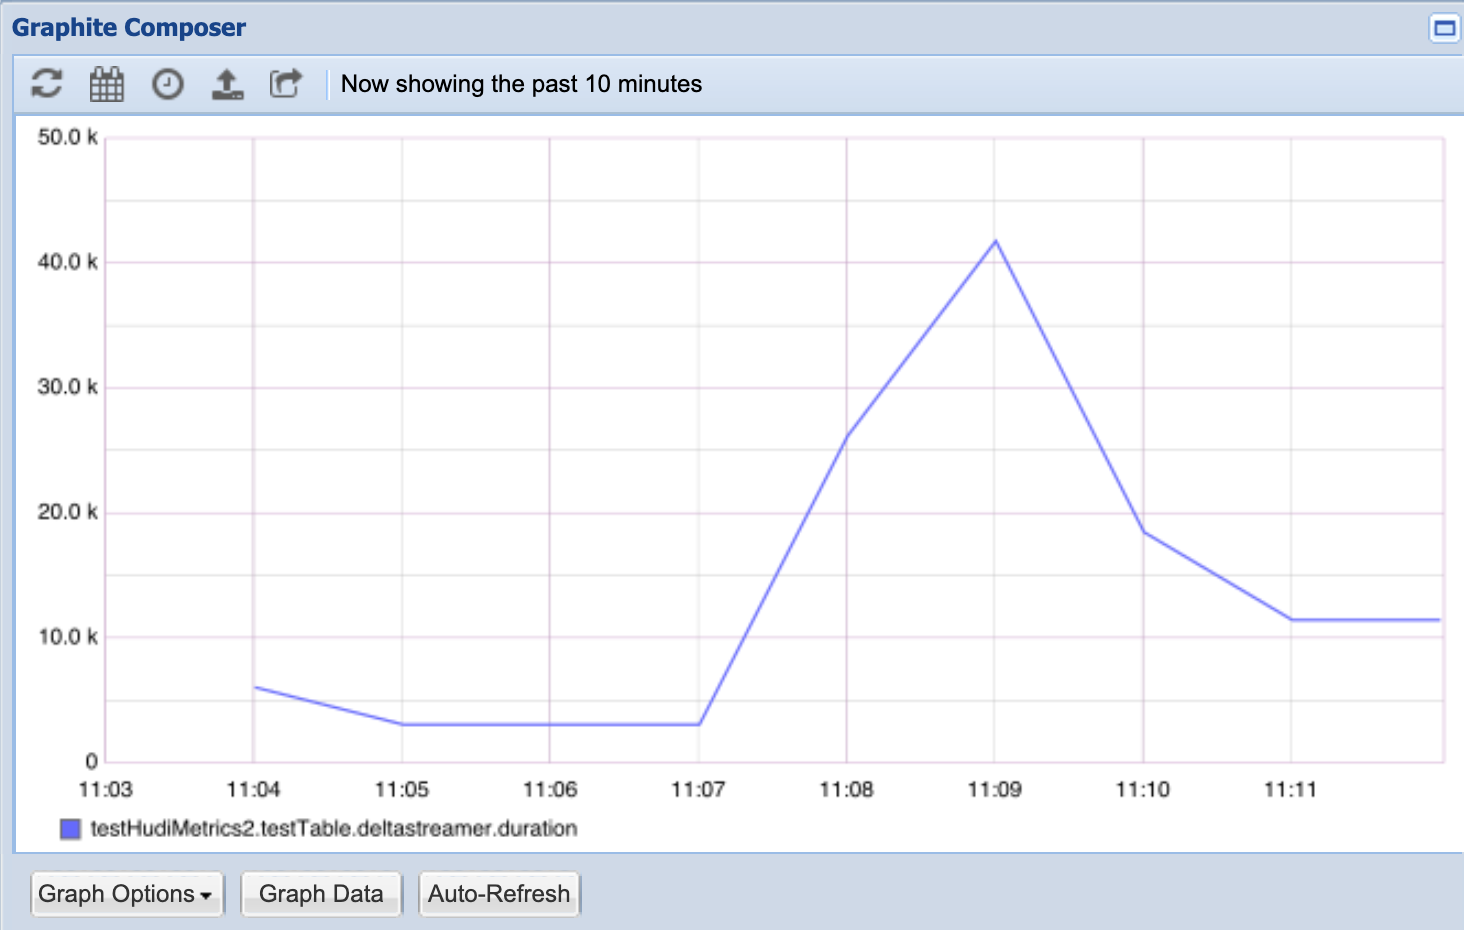
As configured above, assuming a Graphite server is running on host 192.168.0.106 and port 2003, a running Hudi job will connect and report metrics data to it. Below is an illustration of monitoring hudi metrics through Graphite.
DatadogMetricsReporter
DatadogMetricsReporter is an implementation of Datadog reporter. A reporter which publishes metric values to Datadog monitoring service via Datadog HTTP API.
Configurations
The following is an example of DatadogMetricsReporter. More detailed configurations can be referenced here.
hoodie.metrics.on=true
hoodie.metrics.reporter.type=DATADOG
hoodie.metrics.datadog.api.site=EU # or US
hoodie.metrics.datadog.api.key=<your api key>
hoodie.metrics.datadog.metric.prefix=<your metrics prefix>
hoodie.metrics.datadog.api.sitewill set the Datadog API site, which determines whether the requests will be sent to api.datadoghq.eu (EU) or api.datadoghq.com (US). Set this according to your Datadog account settings.hoodie.metrics.datadog.api.keywill set the api key.hoodie.metrics.datadog.metric.prefixwill help segregate metrics by setting different prefixes for different jobs. Note that it will use.to delimit the prefix and the metric name. For example, if the prefix is set tofoo, thenfoo.will be prepended to the metric name.
Demo
In this demo, we ran a Hudi Streamer job with HoodieMetrics turned on and other configurations set properly.
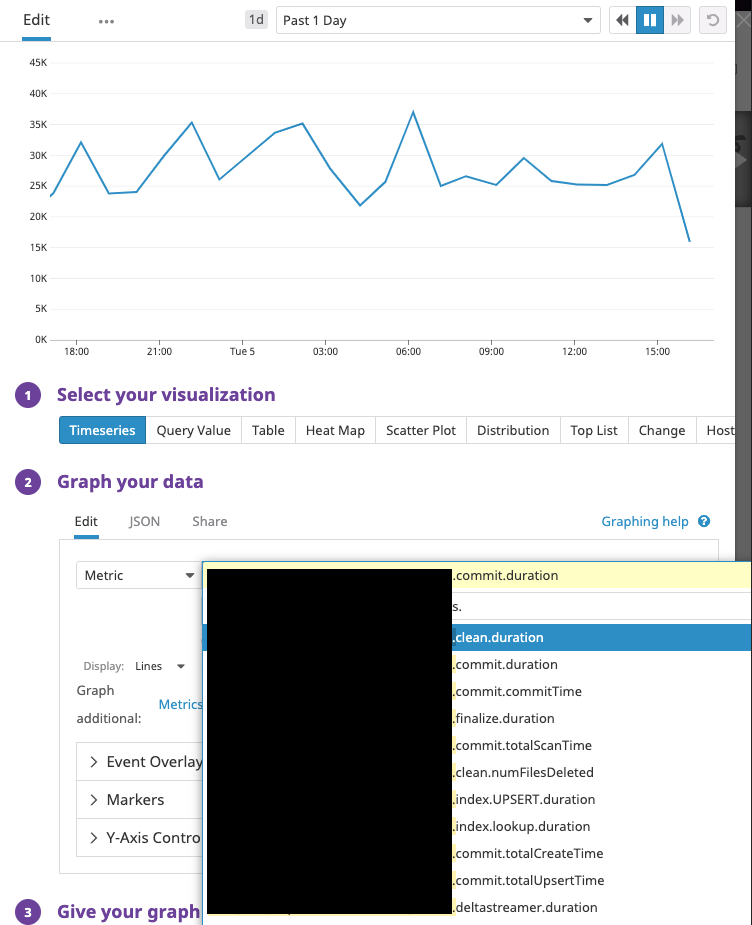
As shown above, we were able to collect Hudi's action-related metrics like
<prefix>.<table name>.commit.totalScanTime<prefix>.<table name>.clean.duration<prefix>.<table name>.index.lookup.duration
as well as Hudi-Streamer-specific metrics
<prefix>.<table name>.deltastreamer.duration<prefix>.<table name>.deltastreamer.hiveSyncDuration
PrometheusMetricsReporter
Prometheus is an open source systems monitoring and alerting toolkit. Prometheus has a PushGateway that Apache Hudi can leverage for metrics reporting. Follow Prometheus documentation for basic setup instructions.
Similar to other supported reporters, the following attributes are required to enable pushgateway reporters:
hoodie.metrics.on=true
hoodie.metrics.reporter.type=PROMETHEUS_PUSHGATEWAY
The following properties are used to configure the address and port number of pushgateway. The default address is localhost, and the default port is 9091
hoodie.metrics.pushgateway.host=xxxx
hoodie.metrics.pushgateway.port=9091
You can configure whether to delete the monitoring information from pushgateway at the end of the task, the default is true
hoodie.metrics.pushgateway.delete.on.shutdown=false
You can configure the task name prefix and whether a random suffix is required. The default is true
hoodie.metrics.pushgateway.job.name=xxxx
hoodie.metrics.pushgateway.random.job.name.suffix=false
AWS CloudWatchReporter
Hudi supports publishing metrics to Amazon CloudWatch. It can be configured by setting hoodie.metrics.reporter.type
to “CLOUDWATCH”. Static AWS credentials to be used can be configured using
hoodie.aws.access.key,
hoodie.aws.secret.key,
hoodie.aws.session.token properties.
In the absence of static AWS credentials being configured, DefaultAWSCredentialsProviderChain will be used to get
credentials by checking environment properties. Additional Amazon CloudWatch reporter specific properties that can be
tuned are in the HoodieMetricsCloudWatchConfig class.
UserDefinedMetricsReporter
Allows users to define a custom metrics reporter.
Configurations
The following is an example of UserDefinedMetricsReporter. More detailed configurations can be referenced here.
hoodie.metrics.on=true
hoodie.metrics.reporter.class=test.TestUserDefinedMetricsReporter
Demo
In this simple demo, TestMetricsReporter will print all gauges every 10 seconds
public static class TestUserDefinedMetricsReporter
    extends AbstractUserDefinedMetricsReporter {
  private static final Logger log = LogManager.getLogger(DummyMetricsReporter.class);

  private ScheduledExecutorService exec = Executors.newScheduledThreadPool(1, r -> {
      Thread t = Executors.defaultThreadFactory().newThread(r);
      t.setDaemon(true);
      return t;
  });

  public TestUserDefinedMetricsReporter(Properties props, MetricRegistry registry) {
    super(props, registry);
  }

  @Override
  public void start() {
    exec.schedule(this::report, 10, TimeUnit.SECONDS);
  }

  @Override
  public void report() {
    this.getRegistry().getGauges().forEach((key, value) ->
      log.info("key: " + key + " value: " + value.getValue().toString()));
  }

  @Override
  public Closeable getReporter() {
    return null;
  }

  @Override
  public void stop() {
    exec.shutdown();
  }
}
HoodieMetrics
Once the Hudi writer is configured with the right table and environment for HoodieMetrics, it produces the following HoodieMetrics, that aid in debugging hudi tables
- Commit Duration - The amount of time it took to successfully commit a batch of records
- Rollback Duration - Similarly, the amount of time taken to undo partial data left over by a failed commit (rollback happens automatically after a failing write)
- File Level metrics - Shows the amount of new files added, versions, deleted (cleaned) in each commit
- Record Level Metrics - Total records inserted/updated etc per commit
- Partition Level metrics - number of partitions upserted (super useful to understand sudden spikes in commit duration)
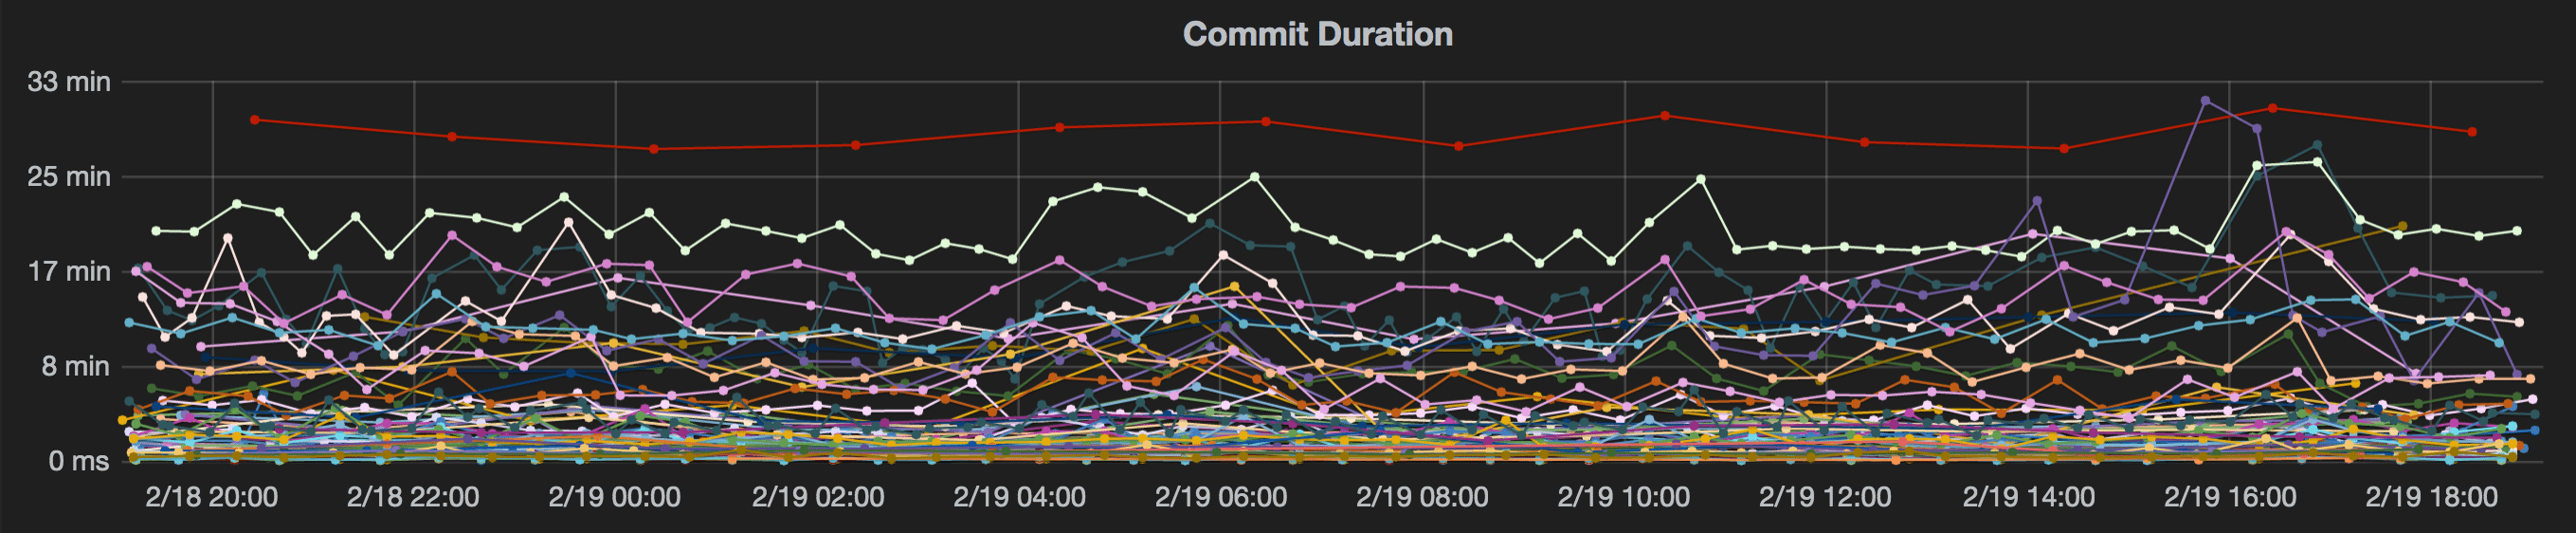
These HoodieMetrics can then be plotted on a standard tool like grafana. Below is a sample commit duration chart.
List of metrics:
The metrics below are emitted across timeline operations (deltacommit, compaction, clustering, rollback, clean, archival) and post-commit callbacks. When hoodie.metrics.reporter.metricsname.prefix is set, every name is prefixed with <prefix>.<name>.
| Name | Description |
|---|---|
| commitFreshnessInMs | Milliseconds from the commit end time and the maximum event time of the incoming records. |
| commitLatencyInMs | Milliseconds from the commit end time and the minimum event time of incoming records. |
| commitTime | Time of commit in epoch milliseconds. |
| duration | Total time taken for the commit/rollback in milliseconds. |
| numFilesDeleted | Number of files deleted during a clean/rollback. |
| numFilesFinalized | Number of files finalized in a write. |
| totalBytesWritten | Bytes written in a HoodieCommit. |
| totalCompactedRecordsUpdated | Number of records updated in a compaction operation. |
| totalCreateTime | Time taken for file creation during a Hoodie Insert operation. |
| totalFilesInsert | Number of newly written files in a HoodieCommit. |
| totalFilesUpdate | Number of files updated in a HoodieCommit. |
| totalInsertRecordsWritten | Number of records inserted or converted to updates (for small file handling) in a HoodieCommit. |
| totalLogFilesCompacted | Number of log files under a base file in a file group compacted. |
| totalLogFilesSize | Total size in bytes of all log files under a base file in a file group. |
| totalPartitionsWritten | Number of partitions that took writes in a HoodieCommit. |
| totalRecordsWritten | Number of records written in a HoodieCommit. For inserts, the total records inserted; for updates, the total records in the file. |
| totalScanTime | Time taken for reading and merging log blocks in a log file. |
| totalUpdateRecordsWritten | Number of records that got changed in a HoodieCommit. |
| totalUpsertTime | Time taken for Hoodie Merge. |
| clean.duration | Wall-clock time in milliseconds for a clean operation. |
| archive.duration | Wall-clock time in milliseconds for an archive operation. |
| rollback.failure.counter | Incremented each time a rollback operation fails. |
| postCommit.success.counter | Incremented each time all post-commit callbacks succeed. |
| postCommit.failure.counter | Incremented each time a post-commit callback fails (post-commit failures are non-fatal). |
| postCommit.duration | Wall-clock time in milliseconds for post-commit callback execution. |
| archival.archivalNumAllCommits | Total number of instants archived in this archival run. |
| archival.archivalNumWriteCommits | Number of write instants (commit, deltacommit, replacecommit) archived. |
| archival.archivalNumCleanCommits | Number of clean instants archived. |
| archival.archivalNumRollbackCommits | Number of rollback instants archived. |
| archival.archivalStatus | 1 if archival succeeded, -1 if it failed. |
| archival.archivalFailure.<ExceptionClassName> | Incremented on archival failure; the suffix is the simple class name of the exception thrown. |
| archival.archivalOutOfMemory | Incremented when archival fails due to an OutOfMemoryError. |
| <action>.totalCorruptedLogBlocks | Number of corrupted log blocks encountered during compaction. Reported only when hoodie.metricscompaction.log.blocks.on=true. <action> is the commit action type (e.g., commit). |
| <action>.totalRollbackLogBlocks | Number of rollback log blocks encountered during compaction. Reported only when hoodie.metricscompaction.log.blocks.on=true. |
| <action>.totalLogBlocksCompacted | Total number of log blocks compacted. Reported only when hoodie.metricscompaction.log.blocks.on=true. |
These metrics live in org.apache.hudi.metrics.HoodieMetrics (with archival-specific names sourced from org.apache.hudi.client.utils.ArchivalMetrics) and are referenced from org.apache.hudi.common.model.HoodieCommitMetadata and org.apache.hudi.common.model.HoodieWriteStat.
In multi-tenant deployments where a single Spark job writes to multiple Hudi tables, each table gets its own isolated MetricRegistry, scoped as <tableName>.<registryName> so metrics from different tables do not collide. No configuration is required.