Spark Tuning Guide
To get a better understanding of where your Hudi jobs is spending its time, use a tool like YourKit Java Profiler, to obtain heap dumps/flame graphs.
Writing
General Tips
Writing data via Hudi happens as a Spark job and thus general rules of spark debugging applies here too. Below is a list of things to keep in mind, if you are looking to improving performance or reliability.
Input Parallelism : By default, Hudi follows the input parallelism. Bump this up accordingly if you have larger inputs, that can cause more shuffles. We recommend tuning shuffle parallelism hoodie.[insert|upsert|bulkinsert].shuffle.parallelism such that its at least input_data_size/500MB.
Off-heap memory : Hudi writes parquet files and that needs good amount of off-heap memory proportional to schema width. Consider setting something like spark.executor.memoryOverhead or spark.driver.memoryOverhead, if you are running into such failures.
Spark Memory : Typically, hudi needs to be able to read a single file into memory to perform merges or compactions and thus the executor memory should be sufficient to accomodate this. In addition, Hudi caches the input to be able to intelligently place data and thus leaving some spark.memory.storageFraction will generally help boost performance.
Sizing files: Set target file sizes judiciously, to balance ingest/write latency vs number of files & consequently metadata overhead associated with it.
Timeseries/Log data : Default configs are tuned for database/nosql changelogs where individual record sizes are large. Another very popular class of data is timeseries/event/log data that tends to be more volumnious with lot more records per partition. In such cases consider tuning the bloom filter accuracy to achieve your target index look up time or use a bucketed index configuration. Also, consider making a key that is prefixed with time of the event, which will enable range pruning & significantly speeding up index lookup.
Spark failures
Typical upsert() DAG looks like below. Note that Hudi client also caches intermediate RDDs to intelligently profile workload and size files and spark parallelism. Also Spark UI shows sortByKey twice due to the probe job also being shown, nonetheless its just a single sort.
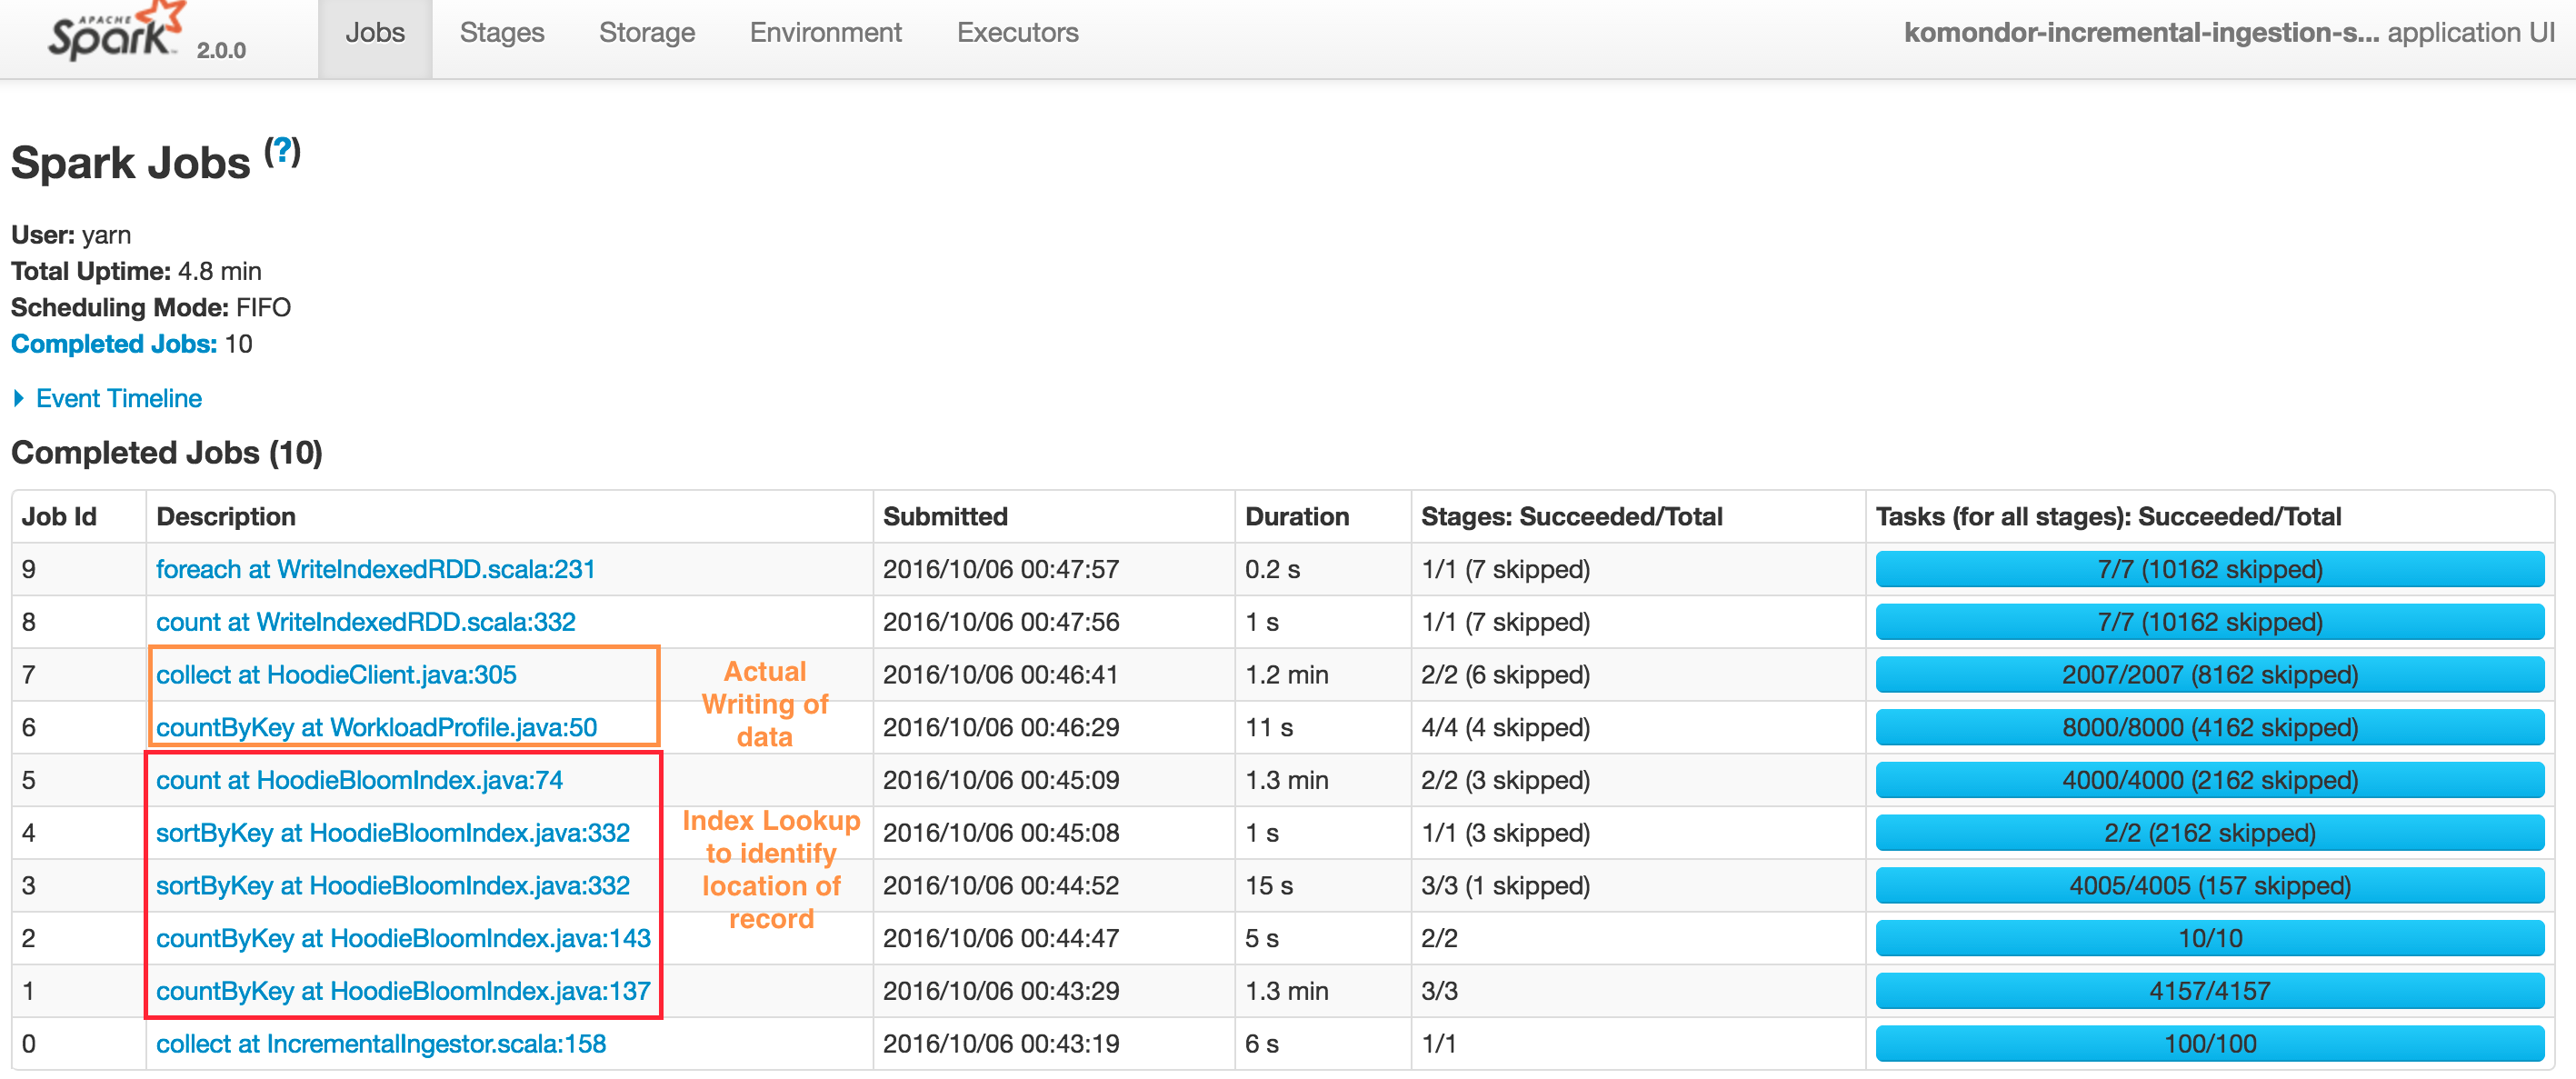
At a high level, there are two steps:
Index Lookup to identify files to be changed
- Job 1 : Triggers the input data read, converts to HoodieRecord object and then stops at obtaining a spread of input records to target partition paths
- Job 2 : Load the set of file names which we need check against
- Job 3 & 4 : Actual lookup after smart sizing of spark join parallelism, by joining RDDs in 1 & 2 above
- Job 5 : Have a tagged RDD of recordKeys with locations
Performing the actual writing of data
- Job 6 : Lazy join of incoming records against recordKey, location to provide a final set of HoodieRecord which now contain the information about which file/partitionpath they are found at (or null if insert). Then also profile the workload again to determine sizing of files
- Job 7 : Actual writing of data (update + insert + insert turned to updates to maintain file size)
Depending on the exception source (Hudi/Spark), the above knowledge of the DAG can be used to pinpoint the actual issue. The most often encountered failures result from YARN/DFS temporary failures. In the future, a more sophisticated debug/management UI would be added to the project, that can help automate some of this debugging.
Hudi consumes too much space in a temp folder while upsert
When upsert large input data, hudi spills part of input data to disk when reach the max memory for merge. if there is enough memory, please increase spark executor's memory and hoodie.memory.merge.fraction option, for example
option("hoodie.memory.merge.fraction", "0.8")
How to tune shuffle parallelism of Hudi jobs ?
First, let's understand what the term parallelism means in the context of Hudi jobs. For any Hudi job using Spark, parallelism equals to the number of spark partitions that should be generated for a particular stage in the DAG. To understand more about spark partitions, read this article. In spark, each spark partition is mapped to a spark task that can be executed on an executor. Typically, for a spark application the following hierarchy holds true
(Spark Application → N Spark Jobs → M Spark Stages → T Spark Tasks) on (E executors with C cores)
A spark application can be given E number of executors to run the spark application on. Each executor might hold 1 or more spark cores. Every spark task will require atleast 1 core to execute, so imagine T number of tasks to be done in Z time depending on C cores. The higher C, Z is smaller.
With this understanding, if you want your DAG stage to run faster, bring T as close or higher to C. Additionally, this parallelism finally controls the number of output files you write using a Hudi based job. Let's understand the different kinds of knobs available:
BulkInsertParallelism → This is used to control the parallelism with which output files will be created by a Hudi job. The higher this parallelism, the more number of tasks are created and hence the more number of output files will eventually be created. Even if you define parquet-max-file-size to be of a high value, if you make parallelism really high, the max file size cannot be honored since the spark tasks are working on smaller amounts of data.
Upsert / Insert Parallelism → This is used to control how fast the read process should be when reading data into the job. Find more details here.
GC Tuning
Please be sure to follow garbage collection tuning tips from Spark tuning guide to avoid OutOfMemory errors. Must Use G1/CMS Collector. Sample CMS Flags to add to spark.executor.extraJavaOptions:
-XX:NewSize=1g -XX:SurvivorRatio=2 -XX:+UseCompressedOops -XX:+UseConcMarkSweepGC -XX:+UseParNewGC -XX:CMSInitiatingOccupancyFraction=70 -XX:+PrintGCDetails -XX:+PrintGCTimeStamps -XX:+PrintGCDateStamps -XX:+PrintGCApplicationStoppedTime -XX:+PrintGCApplicationConcurrentTime -XX:+PrintTenuringDistribution -XX:+HeapDumpOnOutOfMemoryError -XX:HeapDumpPath=/tmp/hoodie-heapdump.hprof
OutOfMemory Errors: If it keeps OOMing still, reduce spark memory conservatively: spark.memory.fraction=0.2, spark.memory.storageFraction=0.2 allowing it to spill rather than OOM. (reliably slow vs crashing intermittently)
Below is a full working production config used at Uber (HDFS/Yarn), for their ingest platform.
spark.driver.extraClassPath /etc/hive/conf
spark.driver.extraJavaOptions -XX:+PrintTenuringDistribution -XX:+PrintGCDetails -XX:+PrintGCDateStamps -XX:+PrintGCApplicationStoppedTime -XX:+PrintGCApplicationConcurrentTime -XX:+PrintGCTimeStamps -XX:+HeapDumpOnOutOfMemoryError -XX:HeapDumpPath=/tmp/hoodie-heapdump.hprof
spark.driver.maxResultSize 2g
spark.driver.memory 4g
spark.executor.cores 1
spark.executor.extraJavaOptions -XX:+PrintFlagsFinal -XX:+PrintReferenceGC -verbose:gc -XX:+PrintGCDetails -XX:+PrintGCTimeStamps -XX:+PrintAdaptiveSizePolicy -XX:+UnlockDiagnosticVMOptions -XX:+HeapDumpOnOutOfMemoryError -XX:HeapDumpPath=/tmp/hoodie-heapdump.hprof
spark.executor.id driver
spark.executor.instances 300
spark.executor.memory 6g
spark.rdd.compress true

spark.kryoserializer.buffer.max 512m
spark.serializer org.apache.spark.serializer.KryoSerializer
spark.shuffle.service.enabled true
spark.submit.deployMode cluster
spark.task.cpus 1
spark.task.maxFailures 4

spark.driver.memoryOverhead 1024
spark.executor.memoryOverhead 3072
spark.yarn.max.executor.failures 100