Real-Time Cloud Security Graphs with Apache Hudi and PuppyGraph
CrowdStrike’s 2025 Global Threat Report puts average eCrime breakout time at 48 minutes, with the fastest at 51 seconds. This means that by the time security teams are even alerted about the potential breach, attackers have already long infiltrated the system. And that’s assuming they even get alerted. Cloud environments generate massive amounts of access logs, configuration changes, alerts, and telemetry. Reviewing these events in isolation rarely surfaces patterns like lateral movement or privilege escalation.
Security tools such as SIEM, CSPM, and cloud workload protection need relationship-based analysis. It is not only a login attempt or a policy change, but also who acted, which systems were touched, what privileges were active, and what happened next. Event-centric methods struggle to answer those questions at scale. Graph analysis fits better because it captures paths and context across entities.
To keep up, the data pipeline must support:
- Continuous upserts with low lag so detections run on the latest state
- Incremental consumption so analytics read only “what changed since T”
- A rewindable timeline so responders can review state during investigations
With Apache Hudi and PuppyGraph, this becomes straightforward. Hudi tables support fast upserts and incremental processing. PuppyGraph queries relationships in place using openCypher or Gremlin. In this blog, we explore how to get started with real-time security graph analytics at scale using the data already stored in your Hudi lakehouse tables.
Why Apache Hudi for Cybersecurity Data?
Apache Hudi is an open data lakehouse platform that brings ACID transaction guarantees to data lakes. It enables efficient, record-level updates and deletes on massive datasets, which makes it a strong foundation for storing and analyzing cybersecurity data such as logs, telemetry, and threat intelligence. Its combination of performance, flexibility, and broad ecosystem integration is well-suited for threat detection, forensic investigation, and compliance work.
Hudi speeds up large-scale security analytics through features that keep tables both current and query-efficient. Hudi writers excel at handling continuous, mutable workloads without requiring costly full rewrites. Hudi’s multi-modal indexing subsystem, backed by its internal metadata table, offers efficient lookups and data skipping, dramatically accelerating queries that scan massive log sets to isolate suspicious activity. Hudi keeps tables updatable and queryable as they change, with time-travel and incremental reads for point-in-time forensic analysis.
Even as data volumes grow, operations remain manageable. Hudi tracks every commit on a timeline, enabling powerful time-travel queries for historical investigations. Asynchronous table services like compaction, clustering, cleaning, and indexing run in the background to maintain peak performance and storage health while minimizing disruption to ingestion pipelines. Furthermore, its consistent commit and delete semantics support the creation of reliable audit trails, simplify data retention policies, and help meet privacy requirements.
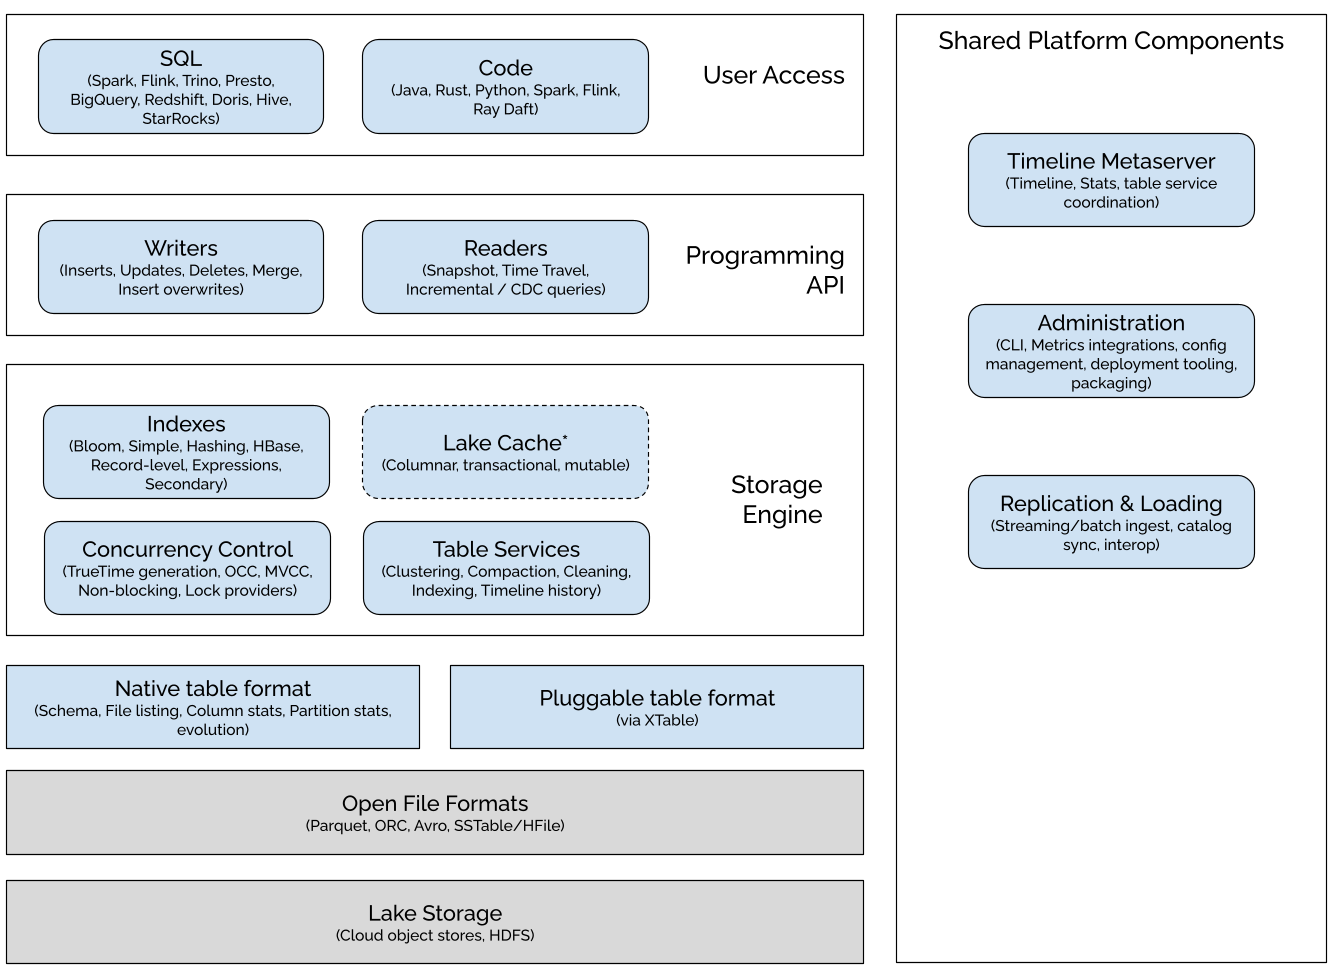
Hudi also integrates seamlessly with the tools security teams already use. You can stream data from Apache Kafka or Debezium CDC into Hudi, register tables in Hive Metastore or AWS Glue Catalog, and query them from popular query engines like Apache Spark, Apache Flink, Presto, Trino, or Amazon Athena. PuppyGraph connects to the same Hudi tables and runs openCypher or Gremlin queries directly on them via the user access layer, so you get real-time graph analytics on the lake with no ETL and no data duplication.
Why PuppyGraph for Cybersecurity Data?
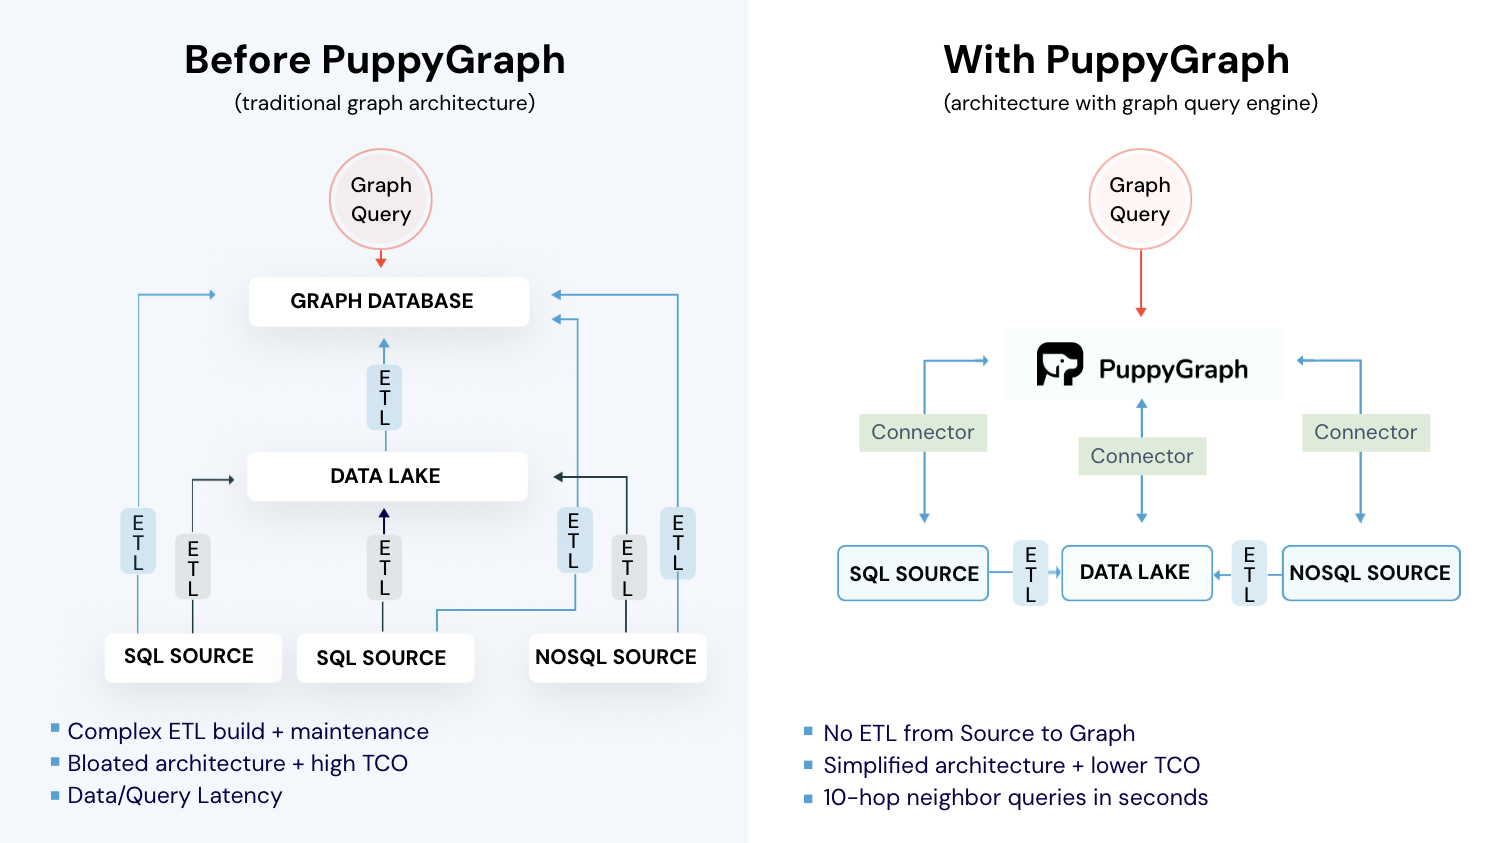
PuppyGraph is the first real-time, zero-ETL graph query engine. It lets data teams query existing relational stores as a single graph and get up and running in under 10 minutes, avoiding the cost, latency, and maintenance of a separate graph database. To understand why this is so important, let’s take a look at the status quo.
Traditional Analytics on the Lake
Security teams already store logs, configs, and alerts in a lakehouse. SQL engines are great for counts, filters, rollups, and point lookups. They struggle when questions depend on relationships. Lateral movement, privilege escalation, and blast radius span many tables and time windows. Each new join adds complexity, pushes latency up, and breaks easily when schemas evolve or events arrive late. You can stitch context with views and pipelines, but it is fragile and slow to adapt.
Dedicated Graph Databases
Graphs make paths and neighborhoods first class. Graph queries let you answer “what connects to what” in a way that makes sense, without the need for confusing data joins. The tradeoff is operations and freshness. Most graph databases want their own storage. That means ETL, a second copy, and lag between source and graph. Continuous upserts are heavy because every change can touch nodes, edges, and multiple indexes. Running a separate cluster adds backups, upgrades, sizing, and vendor-specific tuning. During an incident, that overhead shows up as stale data and slower investigations.
How PuppyGraph Helps
PuppyGraph is not a traditional graph database but a graph query engine designed to run directly on top of your existing data infrastructure without costly and complex ETL (Extract, Transform, Load) processes. This "zero-ETL" approach is its core differentiator, allowing you to query relational data in data warehouses, data lakes, and databases as a unified graph model in minutes.
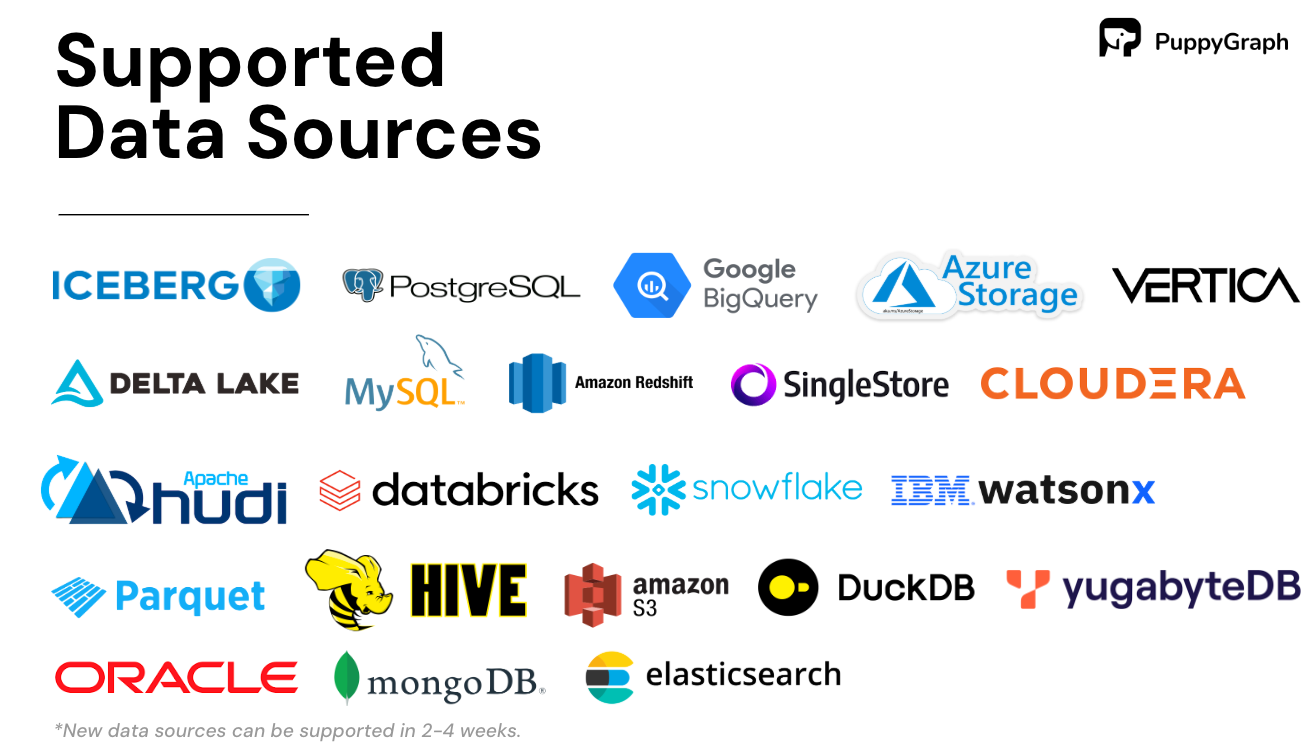
Instead of migrating data into a specialized store, PuppyGraph connects to sources including PostgreSQL, Apache Iceberg, Apache Hudi, BigQuery, and others, then builds a virtual graph layer over them. Graph models are defined through simple JSON schema files, making it easy to update, version, or switch graph views without touching the underlying data. From there, you can quickly begin exploring your data with graph queries written in Gremlin or openCypher.
This approach aligns with the broader shift in modern data stacks to separate compute from storage. You keep data where it belongs and scale query power independently, which supports petabyte-level workloads without duplicating data or managing fragile pipelines.
Real-World Use Case
We have shown why cloud security benefits from a relationship-first view of identities, resources, and events. In this demo, we’ll show how easy it is to begin querying your cloud security data as a graph. Apache Hudi keeps those tables current with streaming upserts and an investigation-friendly timeline. PuppyGraph lets you query your existing lake tables as a graph. Together they give you real-time security graph analytics on the data you already store.
Getting started is straightforward. You will deploy the stack, load security data into Hudi, connect PuppyGraph to your catalog, define a graph view, and run a few queries. All in a matter of minutes.
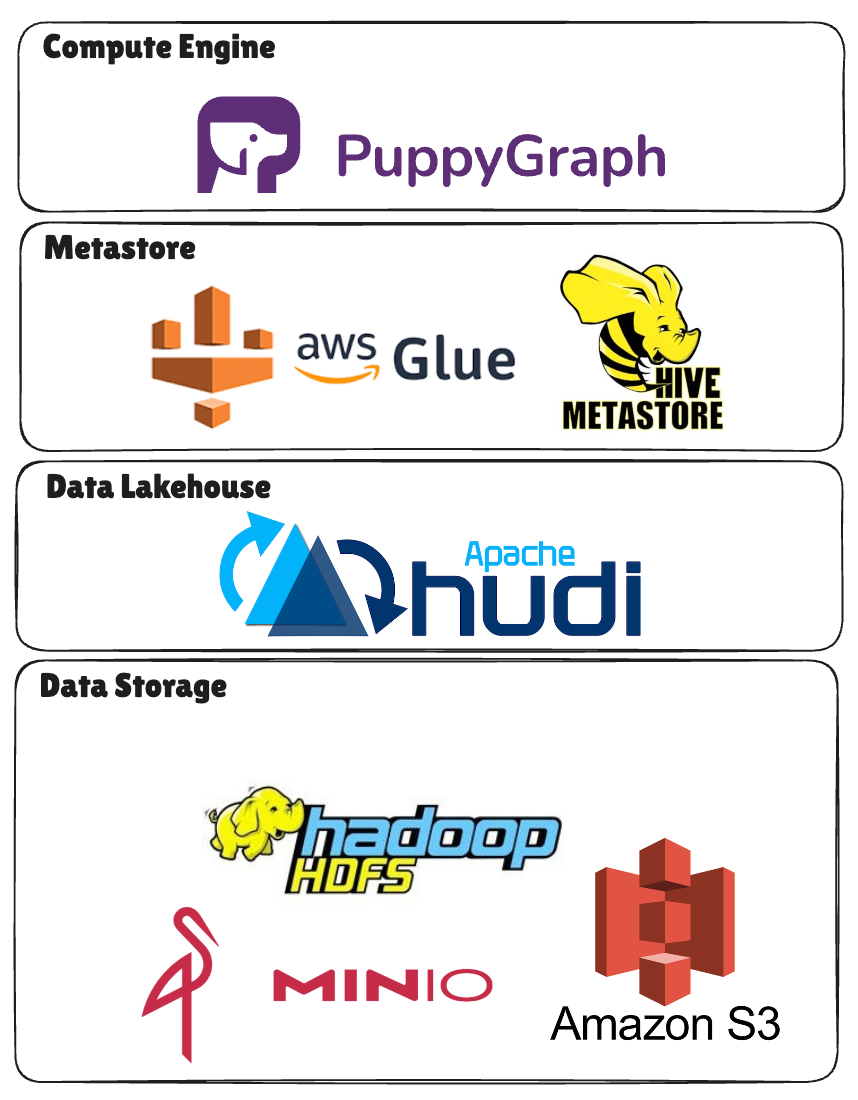
The components of this demo project include:
- Storage: MinIO/S3 – Object store for Hudi data
- Data Lakehouse: Apache Hudi – Brings database functionality to your data lakes
- Catalog: Hive Metastore – Backed by Postgres
- Compute engines:
- Spark – Initial table writes
- PuppyGraph – Graph query engine for complex, multi-hop graph queries
Prerequisites
This tutorial assumes that you have the following:
- Docker and Docker Compose (for setting up the Docker container)
- Python 3 (for managing dependencies)
- PuppyGraph-Hudi Demo Repository
Data Preparation
Before we can load our data into our Hudi tables, we need to make sure they’re in the correct file format. Hudi currently supports Parquet and ORC for base files, and we’ll be going with Parquet for this demo:
python3 -m venv demo
source demo/bin/activate
pip install -r requirements.txt
python3 CsvToParquet.py ./csv_data ./parquet_data
Since we’ll be connecting to the Hudi Catalog via the Hive Metastore (HMS), we also have to install the following dependencies:
mkdir -p lib
curl -L -o lib/postgresql-42.5.1.jar \
https://repo1.maven.org/maven2/org/postgresql/postgresql/42.5.1/postgresql-42.5.1.jar

curl -L -o lib/hadoop-aws-3.3.4.jar \
https://repo1.maven.org/maven2/org/apache/hadoop/hadoop-aws/3.3.4/hadoop-aws-3.3.4.jar

curl -L -o lib/aws-java-sdk-bundle-1.12.262.jar \
https://repo1.maven.org/maven2/com/amazonaws/aws-java-sdk-bundle/1.12.262/aws-java-sdk-bundle-1.12.262.jar
Loading Data
With all our dependencies installed and data prepared, we can launch the required services:
docker compose up -d
Once everything is up and running, we can finally populate the tables with our data:
docker compose exec spark /opt/spark/bin/spark-sql -f /init.sql
Modeling the Graph
Now that our data is loaded in, we can log into the PuppyGraph Web UI at http://localhost:8081 with the default credentials (username: puppygraph, password: puppygraph123)
To model your data as a graph, you can simply select the file `schema.json` in the Upload Graph Schema JSON section and click on Upload.
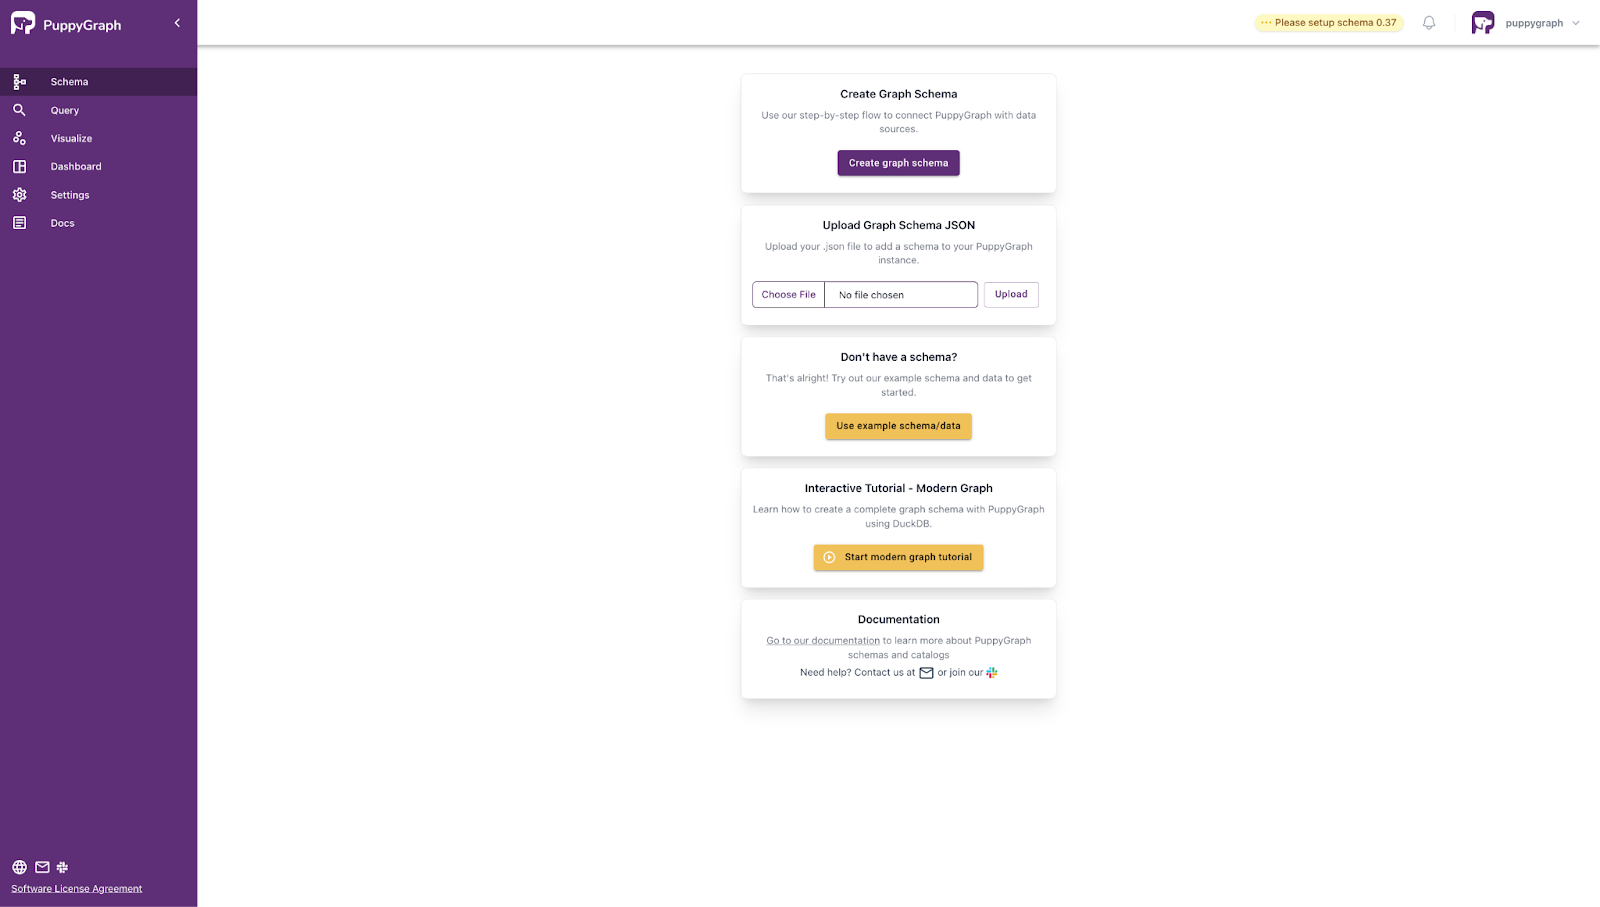
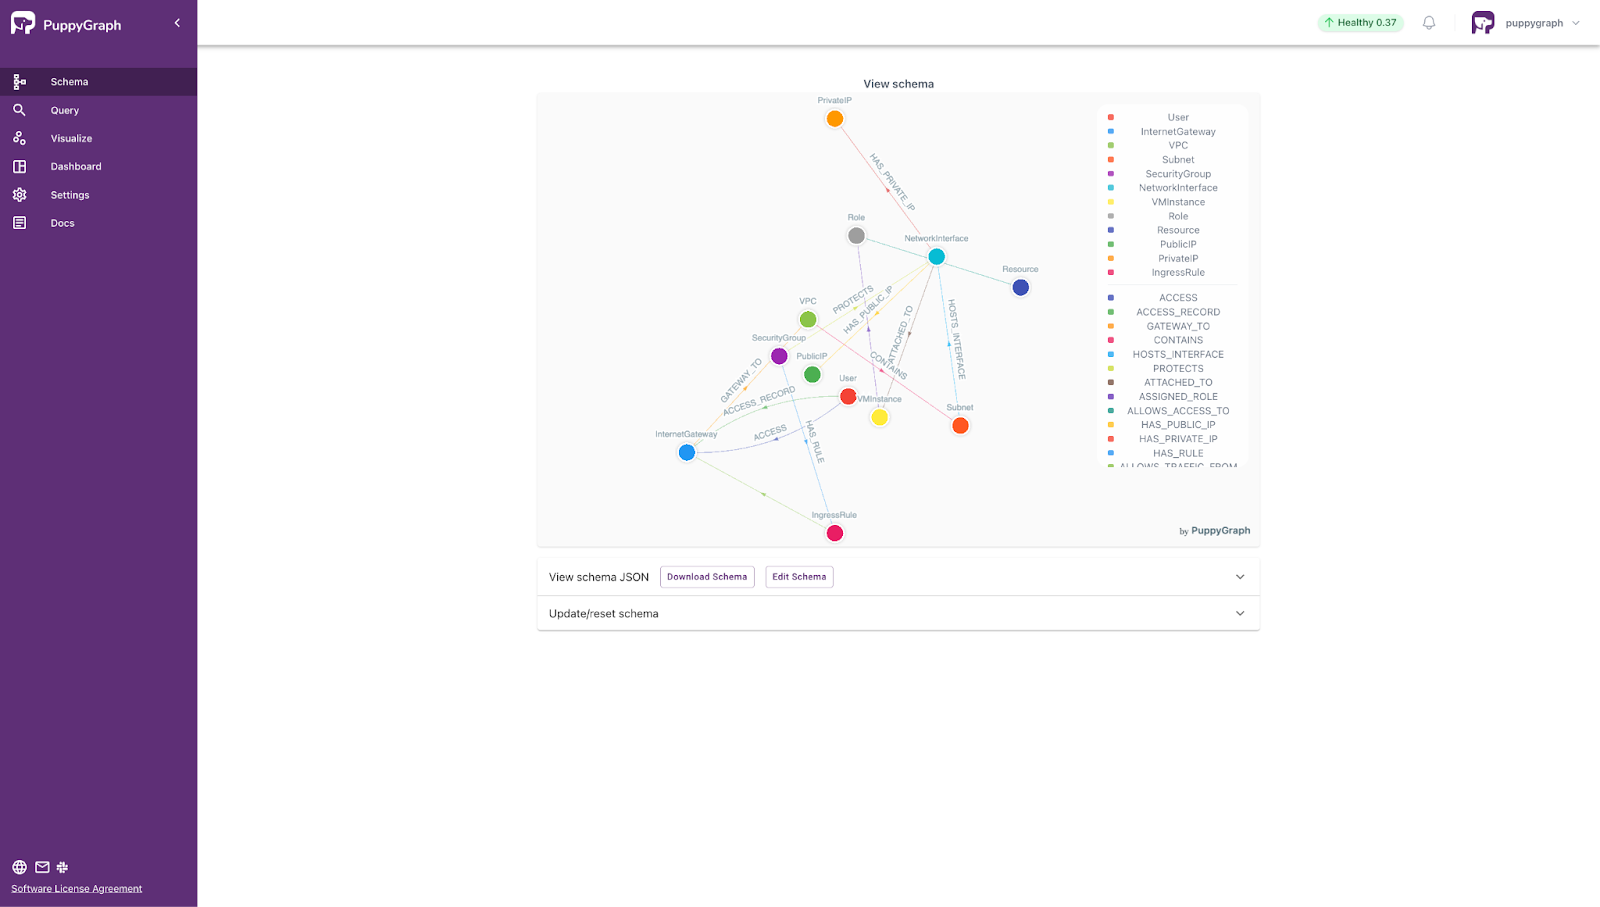
Once you see your graph schema loaded in, you’re ready to start querying your data as a graph.
Sample Queries
By modeling the network infrastructure as a graph, users can identify potential security risks, such as:
- Public IP addresses exposed to the internet
- Network interfaces not protected by any security group
- Roles granted excessive access permissions
- Security groups with overly permissive ingress rules
Listed below are some sample queries you can try running to explore the data:
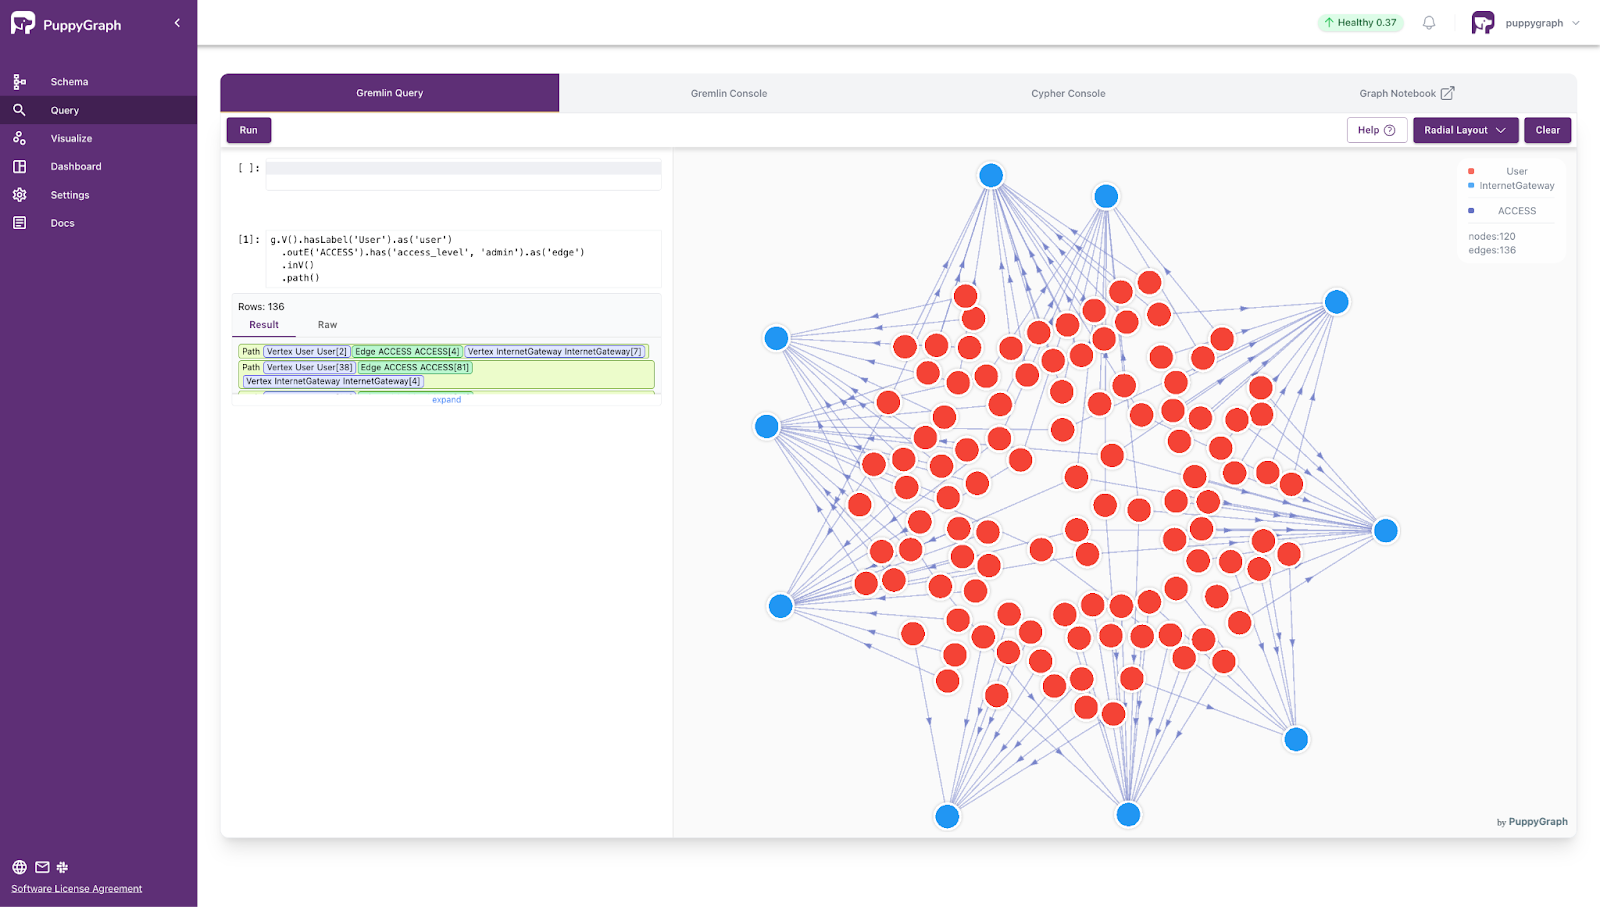
- Tracing Admin Access Paths from Users to Internet Gateways
g.V().hasLabel('User').as('user')
 .outE('ACCESS').has('access_level', 'admin').as('edge')
 .inV()
 .path()
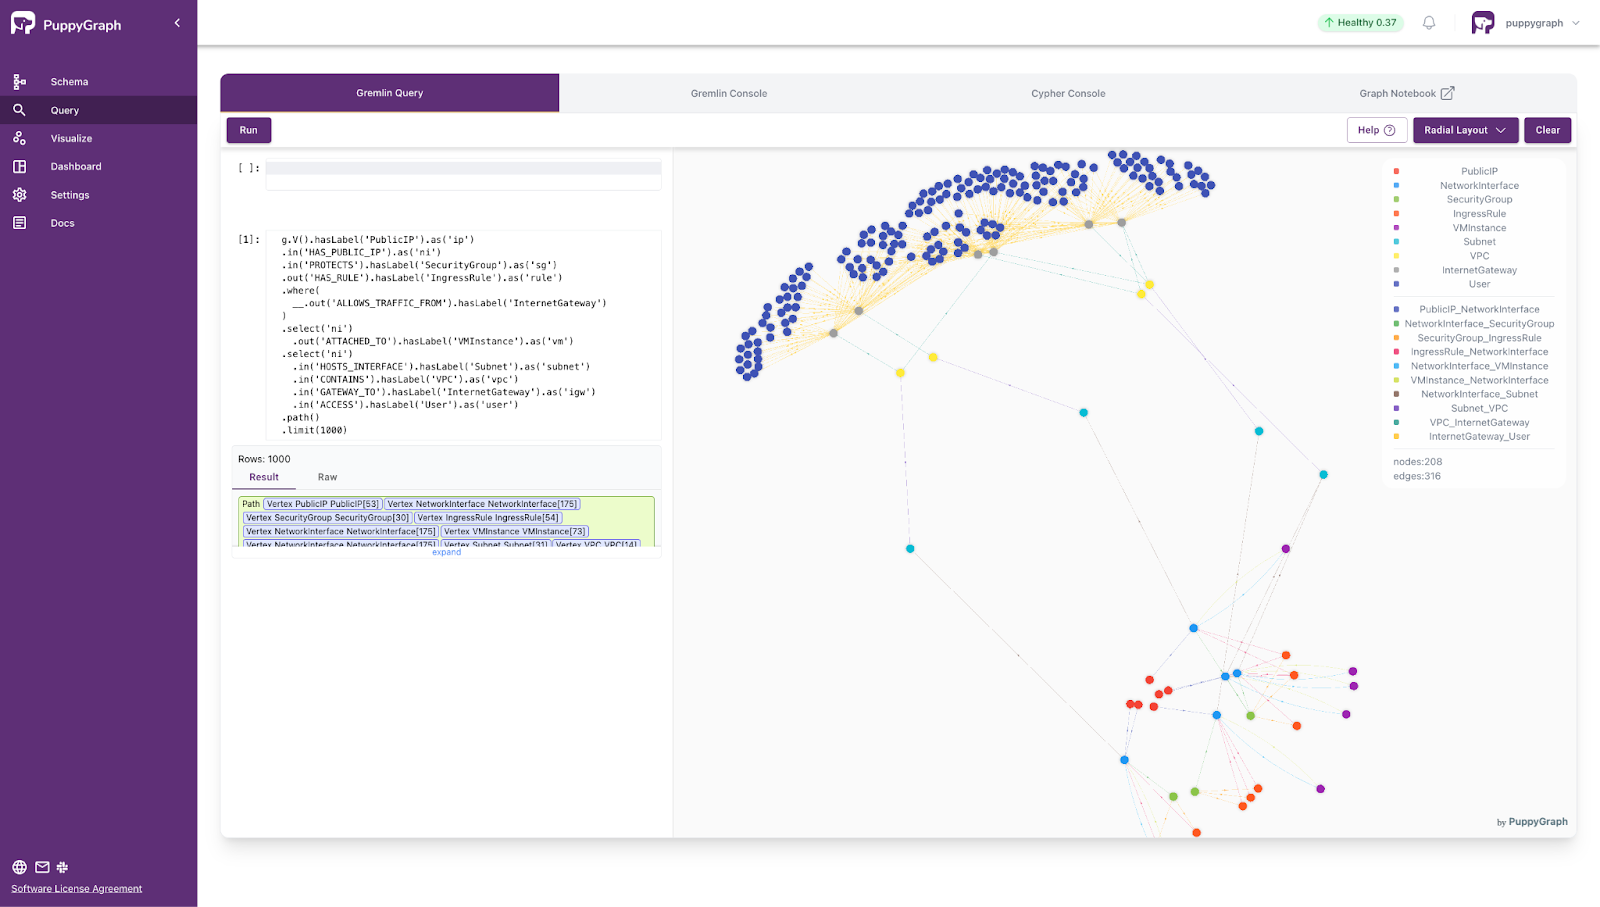
- Find all public IP addresses exposed to the internet, along with their associated virtual machine instances, security groups, subnets, VPCs, internet gateways, and users, displaying all these entities in the traversal path.
 g.V().hasLabel('PublicIP').as('ip')
 .in('HAS_PUBLIC_IP').as('ni')
 .in('PROTECTS').hasLabel('SecurityGroup').as('sg')
 .out('HAS_RULE').hasLabel('IngressRule').as('rule')
 .where(
   __.out('ALLOWS_TRAFFIC_FROM').hasLabel('InternetGateway')
 )
 .select('ni')
   .out('ATTACHED_TO').hasLabel('VMInstance').as('vm')
 .select('ni')
   .in('HOSTS_INTERFACE').hasLabel('Subnet').as('subnet')
   .in('CONTAINS').hasLabel('VPC').as('vpc')
   .in('GATEWAY_TO').hasLabel('InternetGateway').as('igw')
   .in('ACCESS').hasLabel('User').as('user')
 .path()
 .limit(1000)
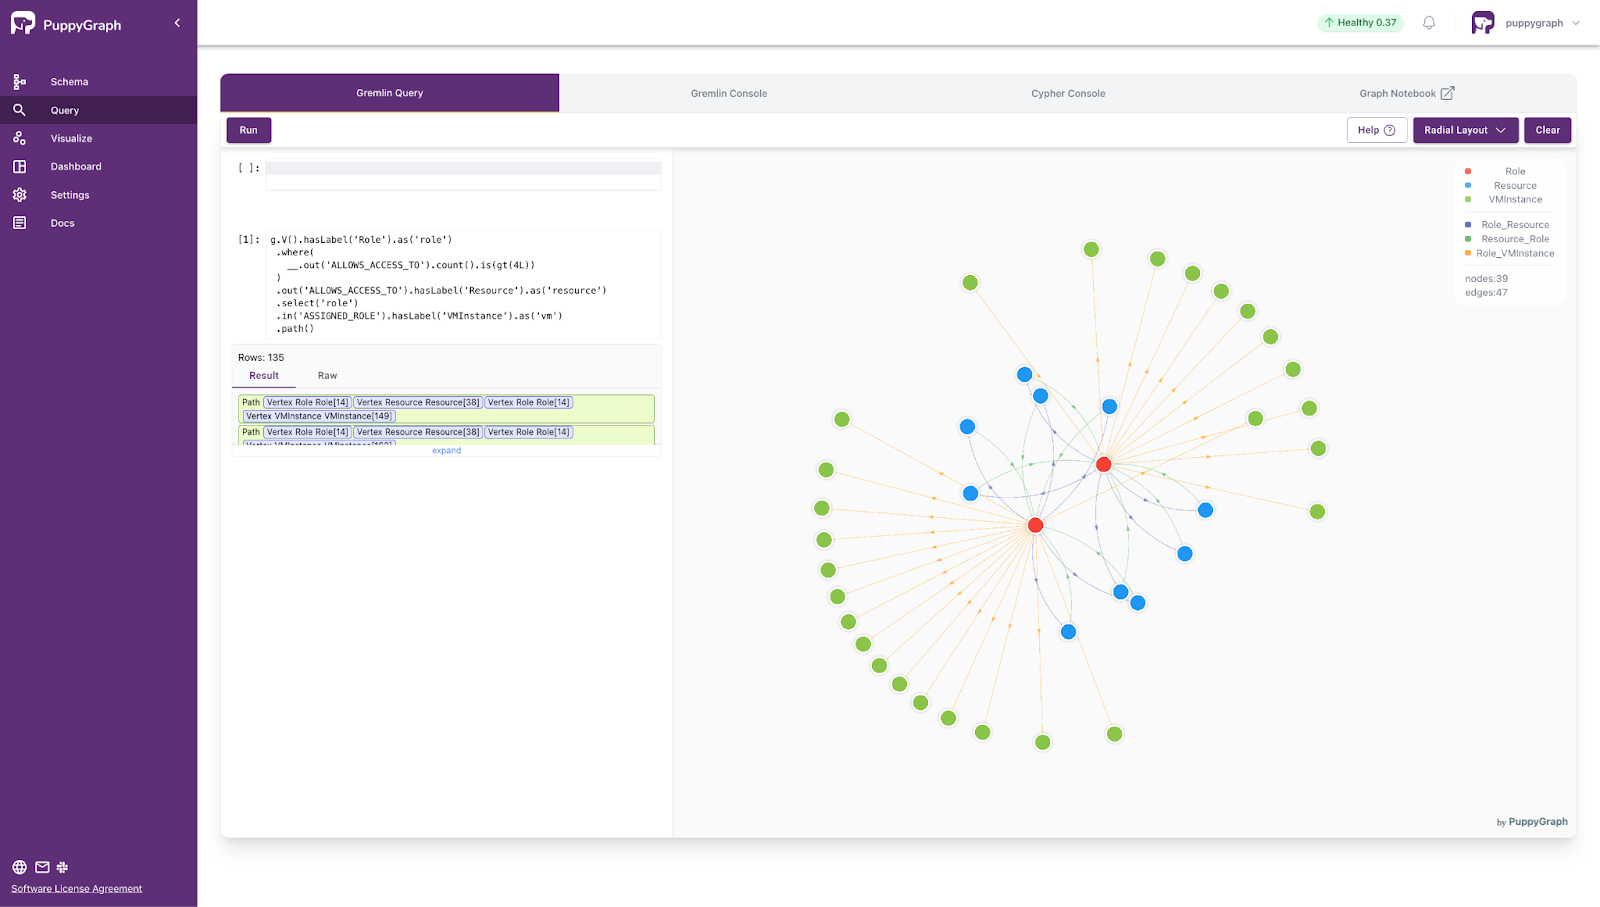
- Find roles that have been granted excessive access permissions, along with their associated virtual machine instances.
g.V().hasLabel('Role').as('role')
.where(
  __.out('ALLOWS_ACCESS_TO').count().is(gt(4L))
)
.out('ALLOWS_ACCESS_TO').hasLabel('Resource').as('resource')
.select('role')
.in('ASSIGNED_ROLE').hasLabel('VMInstance').as('vm')
.path()
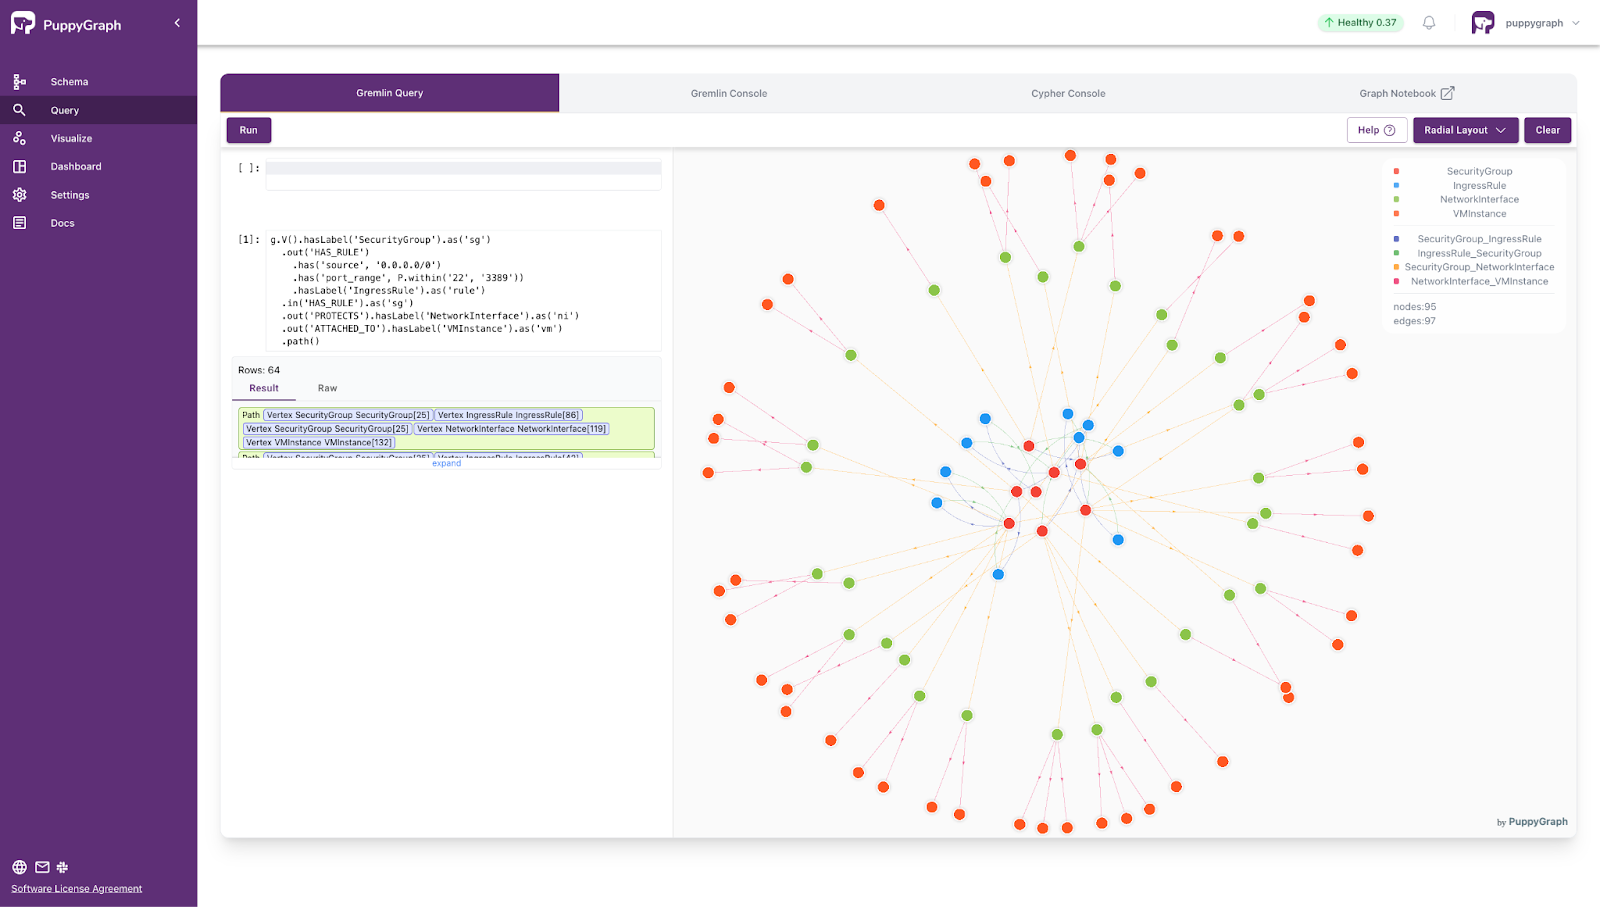
- Find security groups that have ingress rules permitting traffic from any IP address (0.0.0.0/0) to sensitive ports (22 or 3389), and retrieve the associated ingress rules, network interfaces, and virtual machine instances in the traversal path.
g.V().hasLabel('SecurityGroup').as('sg')
 .out('HAS_RULE')
   .has('source', '0.0.0.0/0')
   .has('port_range', P.within('22', '3389'))
   .hasLabel('IngressRule').as('rule')
 .in('HAS_RULE').as('sg')
 .out('PROTECTS').hasLabel('NetworkInterface').as('ni')
 .out('ATTACHED_TO').hasLabel('VMInstance').as('vm')
 .path()
Conclusion
Real-time security work comes down to two needs: fresh tables and connected questions. Apache Hudi keeps lakehouse data current with streaming upserts, incremental reads, and a rewindable timeline. PuppyGraph reads those same tables in place and runs multi-hop graph queries with openCypher or Gremlin. One data copy. No ETL.
The result is faster investigations and clearer decisions. You can trace attack paths, size blast radius, and correlate alerts to recent changes while keeping governance and access controls in a single lake. When you need to look back, time travel gives you point-in-time views without rebuilding pipelines.